Are we entering a recession?
Will the stock market crash?
If you’re like most people, you worry about those things… understandably.
“AI Bubbles,” recession indicators that are “blinking red” – all of that is usual headline fodder these days.
But if you take nothing else away from today’s issue of the Wide Moat Daily, know this: The most important metric for gauging the health of the market and the overall economy is not what you think. In fact, it’s “invisible” to most investors.
It’s a single number, yet it captures almost infinite data points. It tells the story that the pundits, politicians, and bankers won’t.
Today, I’ll show you what it is and what it’s saying.
The Art of the Spread
Spreads are matched in their simplicity only by their value.
When a bank pays 4% on a certificate of deposit (“CD”) and uses the capital to fund a mortgage loan at 7%, the spread is 3%. That sounds simple enough. But why is it not 2% or 5%?
The answer: The difference between the interest rates embodies all the risks involved. Every single one of them.
That includes the opportunity cost of making an auto or commercial loan instead of the mortgage. The spread is a dance that never stops weighing and balancing everything going on in the economy, including projections about the future.
Not all spreads are created equal in their significance. And the high-yield bond spread is easily the most underappreciated, even though it arguably paints the clearest picture about the health of the markets. You wouldn’t guess it at first glance, but it matters just as much for stocks as it does for bonds.
I’ll walk you through exactly what it means and why we should all pay close attention. First things first – here’s what it looks like.
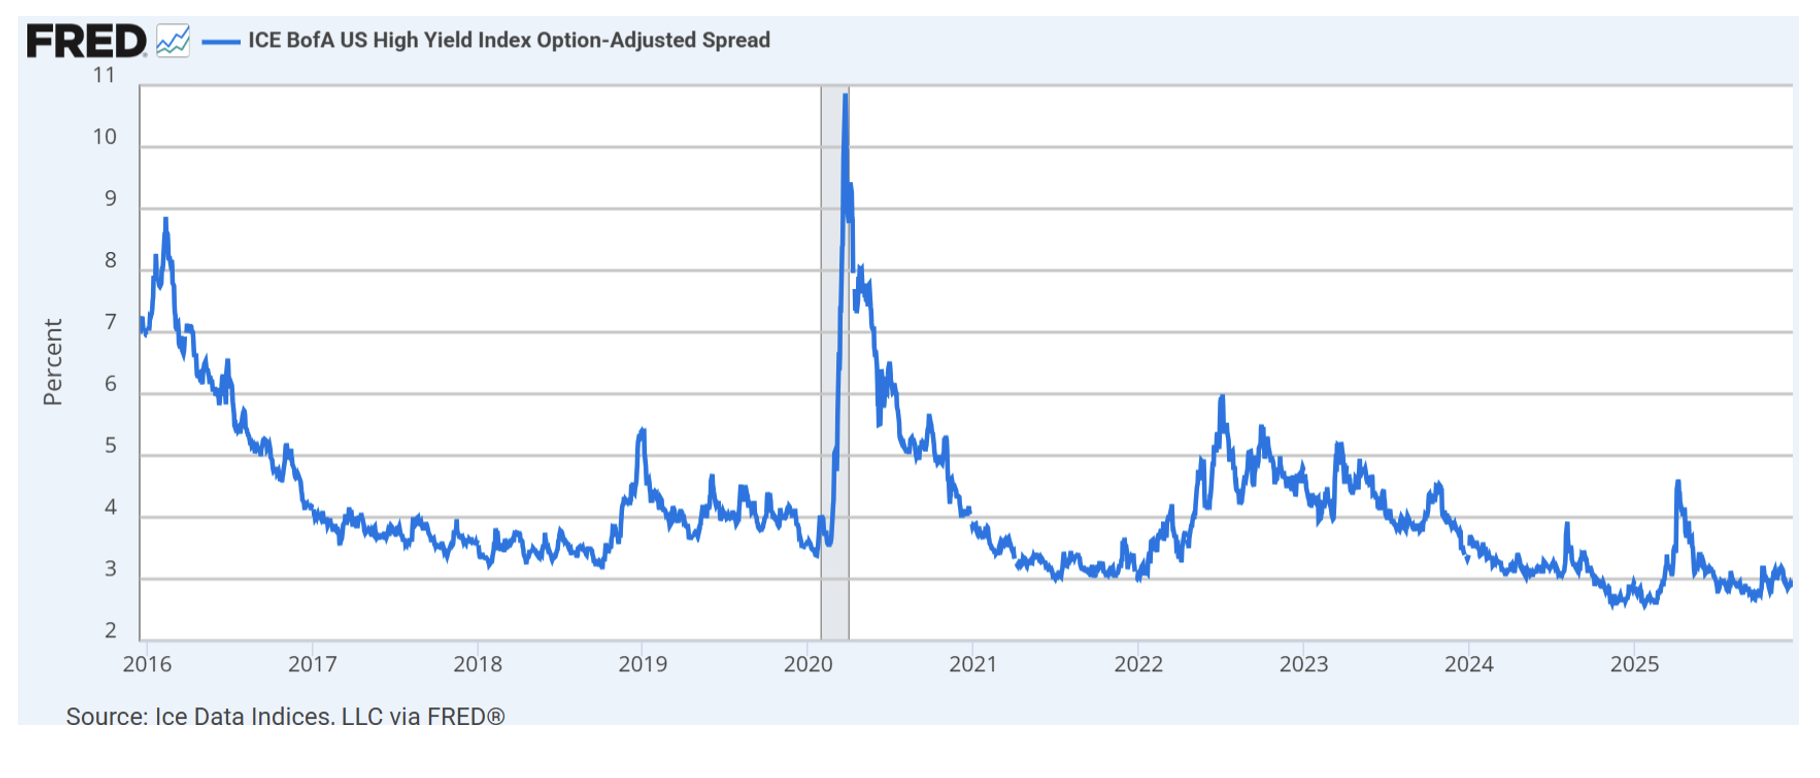
Source: Federal Reserve Bank of St. Louis
This chart from the Federal Reserve shows the difference, or spread, between the yields of bonds classified as high-yield and Treasury rates over the past 10 years.
High-yield bonds, often called junk bonds, are corporate bonds rated below investment grade. This part of the credit market in the U.S. is worth about $1.5 trillion. That’s large, but it’s not the size that matters. Instead, it’s what high-yield represents: the cost of financing higher-risk companies.
Lenders are much more careful about lending to junk-rated firms, and they sharply adjust rates up and down based on perceived risk. Investment-grade bonds and Treasurys are much slower moving and less sensitive to changes in economic conditions. After all, they’re considered more creditworthy.
This is where the magic of the high-yield spread comes in. Since it’s a spread, it doesn’t care about where interest rates stand today versus four or 14 years ago. It’s a measure of perceived risk that can be compared across all timelines.
The Federal Reserve cannot manipulate this spread. Nor can bureaucrats in the European Union, any dictator, or even the U.S. government.
So, what is it saying?
Headlines Versus Hard Data
Several critical takeaways reveal themselves as we look at the high-yield spread over time.
First, the short-term crisis in the high-yield market from 2014 to 2016 is visible on the far left. At that time, junk bonds yielded almost 9% higher than Treasurys. If you recall, investors were afraid that defaults in the oil and gas sector, which is a big double-digit chunk of the high-yield market, were a contagion destined to infect the whole sector.
That didn’t happen.
Instead, the spread fell to a healthy 3% to 5% for the next five years until COVID-19. Investors only demanded 3% to 4% more annual yield from high-yield bonds compared with “risk free” Treasurys.
The pandemic panic caused spreads to increase by over 3 times to around an alarming 11%. With government-forced economic shutdowns and no consistent messaging on when it would end, crisis level of risk was priced into the high-yield market. It only lasted a few months, however, and by mid-2021 the spread was back down to 3% again.
Now, look at the far right of the chart. That is today’s data. There was a small spike earlier in 2025 due to fears about inflation, but it’s gone. Despite the headlines of destructive tariffs, Venezuela speed boats, gridlock in Congress, mounting deficits, and unending stories about the recession that’s always two weeks away, the high-yield spread tells a completely different story.
The difference between high-yield bonds and “risk free” Treasurys is near all-time lows. How is this possible?
Moody’s 2025 high-yield default rate averaged roughly 2.5%, which is well below the long-term average of 4%. Just as key are projections for 2026, which remain similarly optimistic. Leveraged loans are experiencing increasing investor demand. Price levels are improving, liquidity remains strong, and loan yields are attractive versus other fixed income opportunities.
Business development companies (“BDCs”), an area my alternative income High-Yield Advisor service specializes in. These companies are generally showing improving loan performance. Non-accruals and realized losses for top BDCs are well below average.
Bank-related investments are also showing strength. Bank preferred stocks are a great proxy for investor sentiment in the sector, and their spreads are tightening (more investor confidence) as fears from last year’s regional banking crisis recede.
The Only Thing You Can 100% Depend On
The beauty of the high-yield spread is it cannot be manipulated and it completely illustrates the risk investors of all types believe is truly in the markets. It doesn’t care what people say or overweight the opinion of people with bigger platforms. It only values how people act and in perfect proportion to how much skin they have in the game.
To sum it up, if you believe that people like money, which I’d argue Wall Street and Main Street have in common, then the high-yield bond spread works.
Lenders must quickly adjust the rates they charge, or they’ll go out of business. That’s especially the case for more economically sensitive companies that aren’t investment-grade.
As I told subscribers recently, I believe that 2026 is shaping up to be the best year for high-yield investors in a long time. If you know where to look, many areas are still pricing in a severe recession and a huge uptick in defaults.
But if you know the right metrics to study, they’ll tell you that many of today’s beat-up corporate bonds, BDCs, and preferred stocks are pricing in risk that the rest of the market just isn’t seeing. And when that pendulum swings to the upside, we want to be hanging on for the ride.
From my wife and two boys (one is having their first Christmas this year), we hope you have a merry Christmas.
Regards,
Stephen Hester
Chief analyst, Wide Moat Research
|