It doesn’t matter who says it…
It could be muttered by a junior trader over the water cooler or announced confidently by a talking head on CNN. There’s one phrase that sends chills up the spine of every senior trader.
This time is different.
It happens to be the title of one of my favorite books, but that’s a topic for another time. Today, we are talking about oil and war.
You already know the broad strokes. Last Saturday, U.S. and Israeli forces launched an attack on Iran. The country retaliated by sending a barrage of missiles and one-way attack drones to various targets across the region. As you might imagine, this is rippling through the energy markets.
It always feels different, but let’s see what the data says. In this edition of the Wide Moat Daily, we’ll start with a quick history lesson and end with exactly what you need to know as an investor about the latest oil war.
The List
Branded the Arab oil embargo, the first “oil shock” occurred from 1973 to 1974. West Texas Intermediate crude oil, the U.S. benchmark, rose from $3.56 in January 1973 to $11.16 by October 1974.
In the late 1970s, Iran and Iraq went to war. When two of the world’s oil heavyweights enter the ring, we know where prices are headed. Called the second oil shock, prices climbed 166% in 18 months.
The Gulf War kicked off the third oil shock as Iraq invaded its small but oil-rich neighbor, Kuwait. WTI rose from $18.64 in July 1990 to nearly $36 by October 1990, a gain of 93%.
The second Gulf War in the early 2000s aligned with serious unrest in Venezuela, another large oil producer. WTI jumped from under $20 in early 2002 to just under $36 by February 2003, or an 82% increase.
The next oil shock of 2007 to 2008 occurred when I was on the trading floor. Most people remember this period for the financial crisis and the collapse in oil prices in the latter half of 2008. But before that happened, oil prices surged.
This wasn’t tied to a specific conflict but instead is believed to be caused by strong global demand, supply disruptions, and perceived rising geopolitical risks. WTI spiked from $55 in early 2007 to about $134 by June 2008, a gain of nearly 150%.
There was another oil shock tied to the Arab Spring and the Libyan Civil War in 2011. And another in 2022 due to Russia’s full-scale invasion of Ukraine. We are living through the next chapter in this long book, which I’ll touch on later.
After reading this list, a couple things should jump out to you. First, the same names keep appearing. You’ve seen them in the news recently, haven’t you? Second, the percentage gains are predictable. Almost no matter the cause, oil jumps at least 80% and usually stalls around a 150% gain.
But there is something a lot more important that isn’t obvious. It’s something rarely mentioned on TV because fear sells ads.
In 1990, 2003, 2008, 2011, and 2022 – all but the first two oil shocks – prices quickly went back to where they started from. Markets overestimated supply issues and underestimated the oil industry’s drive to take advantage of high prices by increasing supply. Nothing structurally changed, so prices quickly normalized.
The main exception was the first oil shock of the early 1970s. And once I explain why, you won’t look at the oil markets the same way.
Why the Early Oil Shocks Really Were Different
At the time of the first oil shock, OPEC controlled over 50% of global supply. Oil was commonly burned for electricity, so demand was more inelastic. That means demand doesn’t quickly adjust to higher prices. Spare production was negligible, and new projects took up to 10 years to begin producing oil. So, when oil prices spiked and OPEC tightened its grip on the oil market, it had no reason to let go.
Fast forward to today. The Organization of the Petroleum Exporting Countries (“OPEC”) only controls 36% of global production. The U.S. is the world’s largest producer by far. Strategic oil reserves exist in many countries with all International Energy Agency (“IEA”) countries legally required to hold at least 90 days of net oil imports.
Between the U.S. and China alone, there are over 1 billion barrels in storage. Technology is as responsible for production as geology is. That was unthinkable 20 to 30 years ago. And it’s why deepwater and shale production from the U.S. outpaces that of many oil-rich OPEC nations.
Shale, the powerhouse of U.S. production at 8.9 million barrels per day, can go from initial geological assessment to production in less than 12 months. For context, U.S. shale alone is the same as the combined production from Iran and Iraq. And oil-fired power plants only provide 3% of electricity globally today compared with 24% in 1973.
The second oil shock kept prices high for about five years. Iranian oil production fell from roughly 6 million barrels in 1978 to just around 1.5 million in 1979. Just after that, the Iran-Iraq war added gasoline to the shortage fire. Combined, about 7 million barrels, or 11% of global supply, were cut off. That percentage is roughly 4 times Iran’s production today.
OPEC made the bad situation much worse by implementing strict production quotas to maintain the high prices. Take a wild guess what this market manipulation caused.
The North Sea (U.K. and Norway), Alaska’s north slope, Mexico’s giant Cantarell field, and the Soviet Union all rapidly increased production to capture the artificially high prices.
But the party ended when oil prices collapsed from nearly $30 in 1985 to just $11 in 1986. OPEC engineered one of the largest commodity crashes ever recorded.
But as I mentioned before, the situation today is completely different from what it was during the first and second oil shocks.
Every single factor has changed – from OPEC’s grip on the market to the rapid pace shale can go into production.
The Crude Reality on Iran
As of the time of this article, not a single piece of Iran’s oil export infrastructure has been attacked. The Kharg Island export terminal handles 90% of Iranian crude exports. If I can find it on a map, I’m confident U.S. and Israeli spy satellites can. Outside of the Shahr Rey oil refinery and a few storage tanks, the nation’s oil infrastructure is intact. It’s safe to say that’s deliberate.
But what if that changes?
Iran produces 3.8 million to 4 million barrels of oil a day or 3% of global supply. Domestic consumption absorbs half that, with the rest going almost entirely (roughly 85%) to China. Some are tempted to say that even if Iran’s oil exports stop, it’ll only impact China. That’s not the case. China would suddenly be a buyer of 2 million barrels a day on the open market, and that would drive up prices for everyone. Let’s put that into context.
I researched the ability for U.S. shale to add supply. I studied petroleum engineering in graduate school, which helps me know how engineering, economics, and infrastructure work together to get oil from the ground into gas tanks.
In the first six months of an oil shock, U.S. shale can respond quickly to higher prices and increase production by 300,000 to 400,000 barrels per day. That helps, but it’s not enough.
If prices stay high (more than $75), oil companies can reliably manage 1 million to 2 million barrels per day depending on how much they are willing to risk in capital expenditure. Most of that would come from the Permian Basin in West Texas.
Put more simply: The solution to high prices is high prices.
That’s another piece of trading floor wisdom for you.
And if prices are still high, especially in the futures market, oil companies can extract up to 3 million barrels per day from existing shale reserves. For context, shale production increased by 3.3 million barrels per day from 2016 to 2019.
As I talked about in a recent issue of the Wide Moat Daily, Venezuela has the capacity to replace any losses to the export market due to Iran. But that’ll take time (five to 10 years) because it has a lower-quality type of crude oil that takes a lot more time and money to produce.
Is This Time Different?
On one hand, it’s true that U.S. shale reserves will not last forever. At the increased production rates I described, many Tier 1 (the best) areas will be depleted in less than 10 years according to the latest estimates. Companies will keep shifting to Tier 2 assets with less favorable economics but with decades of production capacity. Management teams at oil companies know that going “all-in” on often short-lived price spikes is risky, so they may take their time.
Iran could also try to freeze traffic in the Strait of Hormuz. But I’m not sure for how long given that U.S. strikes have turned most of their Naval ships… into submarines. And if I had a barrel of oil for every time Iran threatened to block the strait, I’d be in the top 10 list by global reserves.
On the other hand, let’s not forget that the “peak oil” theory was presented to the American Petroleum Institute in 1956, and by a geophysics professor from Standard University no less.
It’s been repeated too many times to count. You might remember seeing headlines like this in the 2000s:
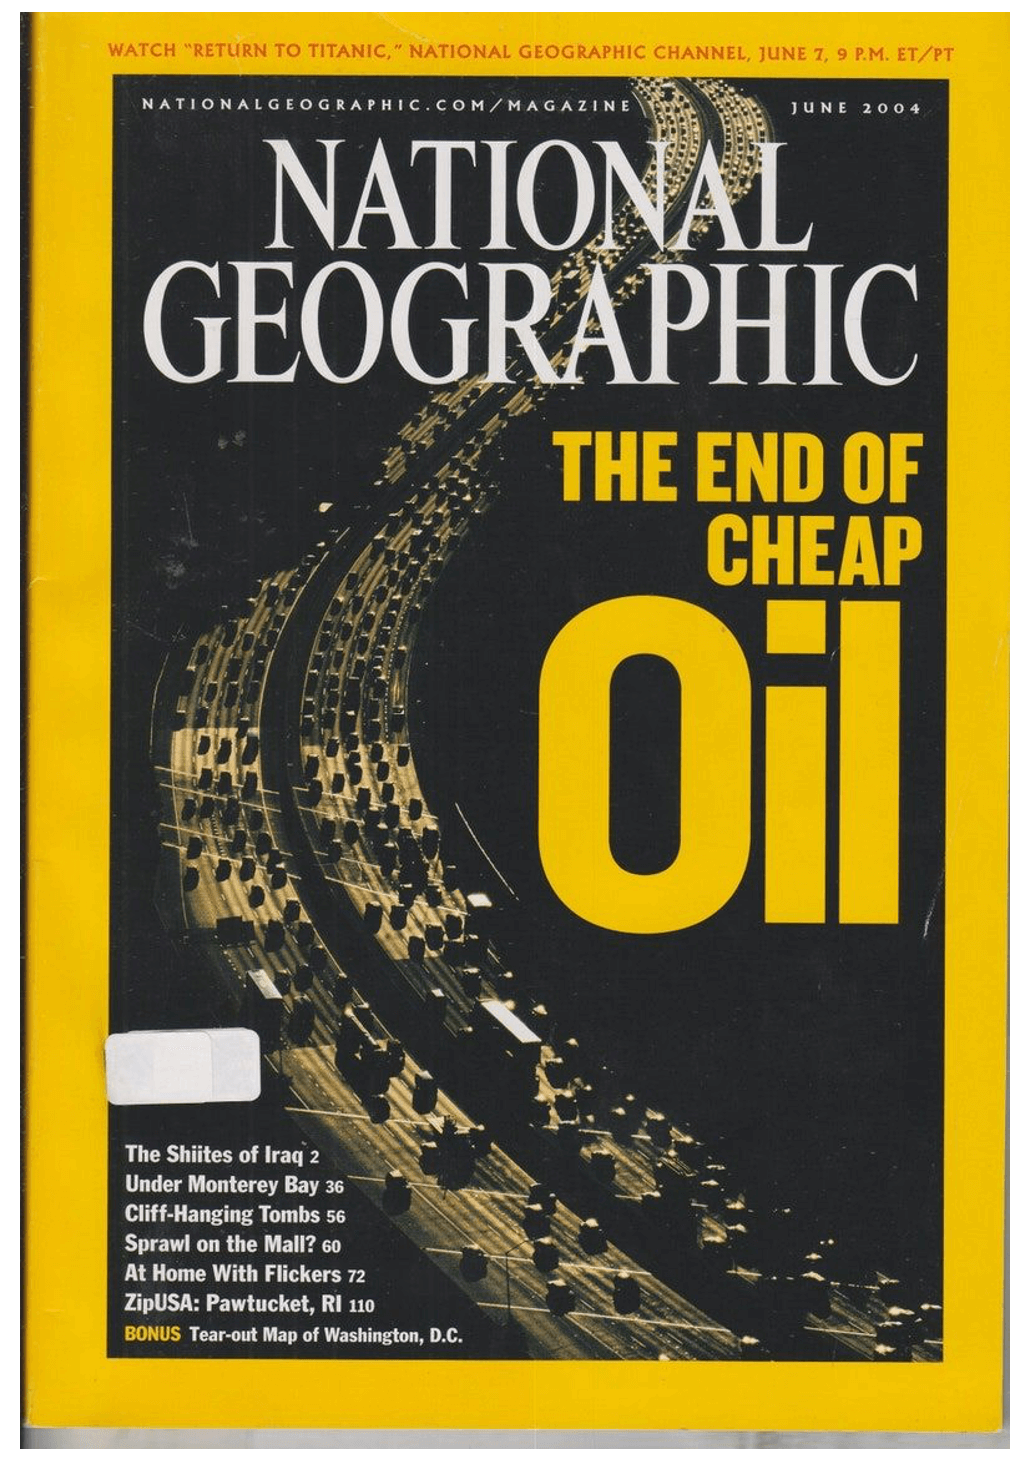
Source: National Geographic
Yet the industry always finds a way to keep the oil flowing.
The same thing happens every time there is an oil shock. Fear drives prices up, market forces push them right back down. WTI has jumped from $65 before the war to $90 today. That’s a roughly 40% gain, or around 63% from 52-week lows. There is a good chance that oil will go even higher and maybe touch $120. But there is an even better chance that it’ll be well below $100 before long.
You’ll be hearing how “this time is different” from your family and friends and “experts” on TV.
But I’ve seen this story several times in my career.
Somehow, this all feels familiar.
Regards,
Stephen Hester
Chief Analyst, Wide Moat Research
|